Monitoring the new Raspberry
Monitoring the new Raspberry
The first thing I want to do before I start installing some software is to have a good monitoring system. I had a very good experience with netdata that comes already installed with CapRover (I am running a CapRover instance on a DigitalOcean droplet) and I want to use it also for my new Raspberry.
I’ve installed it following their official guide “Monitor Pi-hole (and a Raspberry Pi) with Netdata”:
- One line command:
wget -O /tmp/netdata-kickstart.sh https://my-netdata.io/kickstart.sh && sh /tmp/netdata-kickstart.sh --stable-channel. - Access it from
http://RASP_IP:19999/and voilà, it already works!
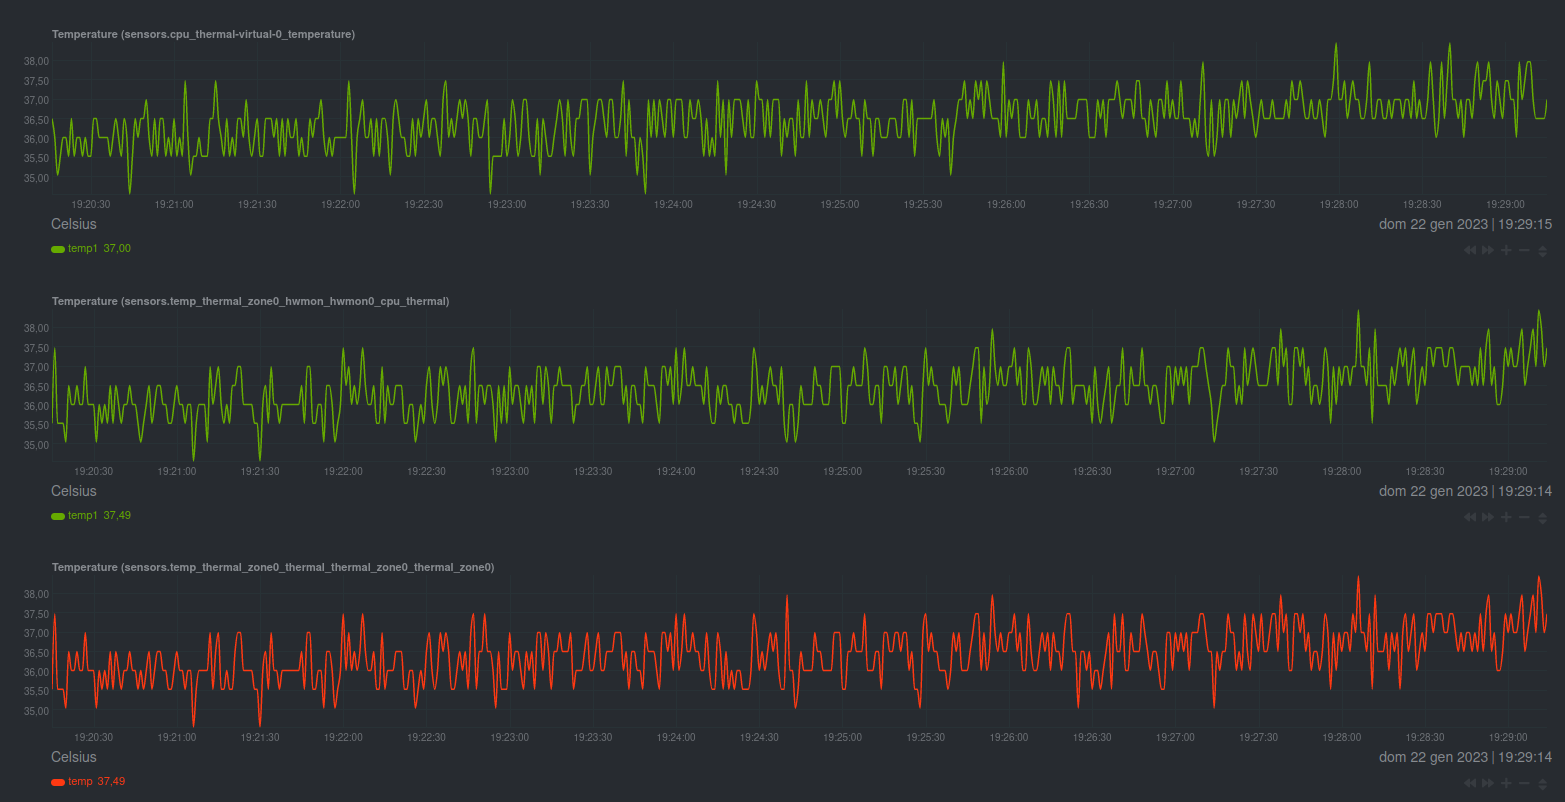
By default the sensors data are not collected and I had to manually enable them. I am curious to see how the temperature fluctuate depending on the load.
- Open the config to edit it
cd /etc/netdata sudo ./edit-config charts.d.conf - Uncomment
sensors=forceand save it (in nanoctlx + xto exit. It will ask to save it.) - Restart it:
sudo systemctl restart netdata
And after some minutes also the sensors data start to show up!